South Africa is one of the few countries on the continent that publishes marriage and divorce data. Even better, Statistics South Africa (StatsSA) makes available individual (couple) information about marriages and divorces. This allows us not to just look at the aggregated statistics reported, but glean different insights given multiple ways of looking at the data.
You know that feeling you get that "everyone gets married in December?"
This is pretty much true, the largest number of marriages are registered in December in South Africa. It seems to do more with the summer as the United States has its highest marriages occurring in June. What's harder is to find the pattern of when divorces happen.
Peak divorce
Continuing on with a macro view, what about the duration of marriage before divorce?
When we look at the South African statistics from 2009-2012 an interesting pattern emerges.
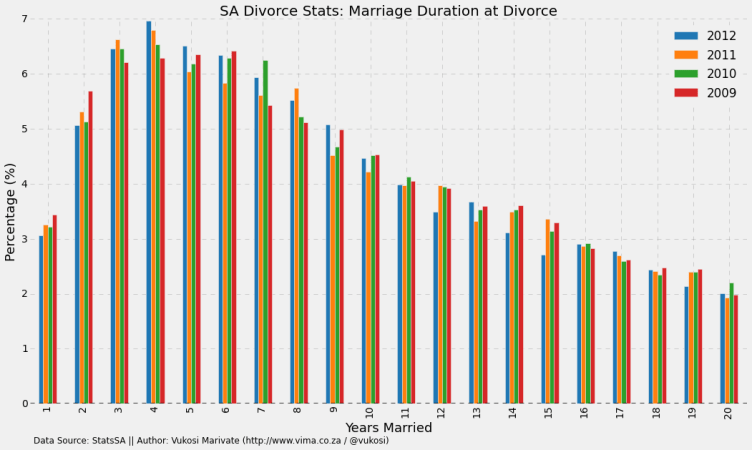
For the reporting period, the peak number of divorces happen at 4 years of marriage. This is slightly different for the year 2009 where the peak was at 6 years. Half of the divorces happen within 10 years of marriage (the figure is truncated at 20 years but the pattern, of continued decline, holds).
This begs the question then about the ages of partners at divorce?
Does age matter for marriage?
Let's look at the proportion of men and women in different age groups.
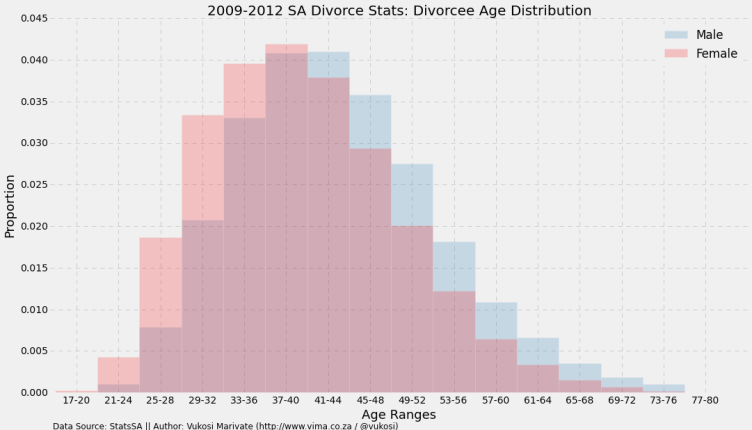
Here we notice that there is slight shift between the peak divorce age for men as compared to women. This is to be expected as women tend to marry men who are2-3 years older. Here is a graphic from Code4SA on the marriage age distribution.
What about the average age of the partner being divorced by men and women?
An interesting pattern emerges.
Interesting divorce patterns
Women tend to be divorcing men who are older than them up until their middle 50s. After this age, women tend to be divorcing men who are, on average, younger than them.
The relative sizes of the points indicate the relative size of the samples in that age group.
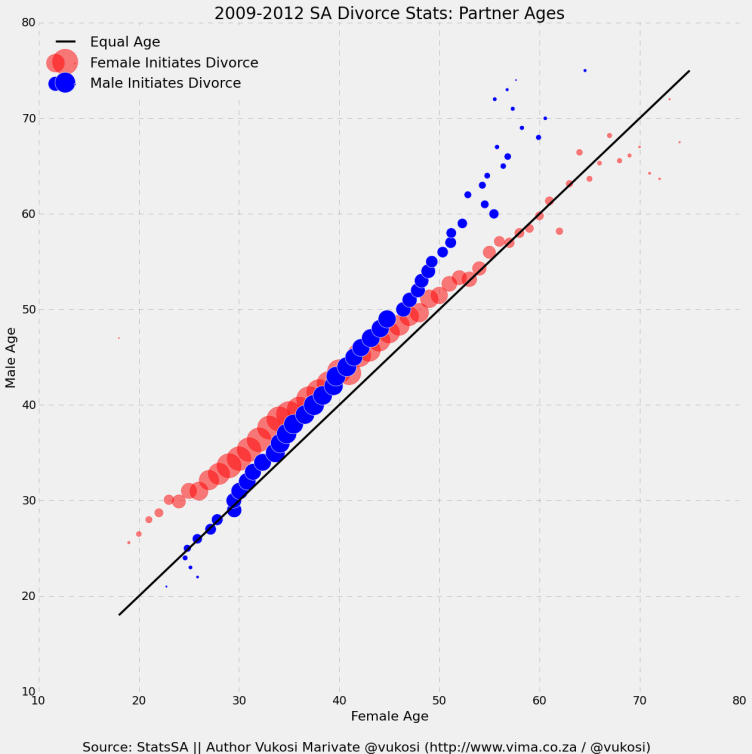
For men though this pattern is opposite, and switches at a much earlier age. Men tend to be divorcing women older than them up to their mid 20s, after which men tend to be initiating divorce against women who are, on average, younger than them, with the age gap increasing as the men in the divorce data set get older.
As such, it begs another question.
Why do Ben 10s divorce Sugar Mamas?
Unfortunately this is hard one to answer and as of yet have not come to find research that can give us some insights on this. Have a theory? Leave it in the comments below.
It’s one thing to look at data such as these and try to find patterns only using numbers, it’s another to understand the underlying reasons for divorces in SA. This gap can be filled by colleagues from the social sciences.
Work by L. Ackerman from University of the Free State explored South Africa's divorce data up to 2000 and the possible reasons for the increase in the raw number of divorces as well as the majority of divorces being initiated by women. One interesting possible reason for divorces increasing in the 90s was the empowerment of women.
More and more women started working and as such were more independent. What I found more interesting was that the empowerment of women might be the reason that both women and men started initiating divorces more, the men might see their partner as being able to take care of themselves and there are now better laws in respect of custody of children.
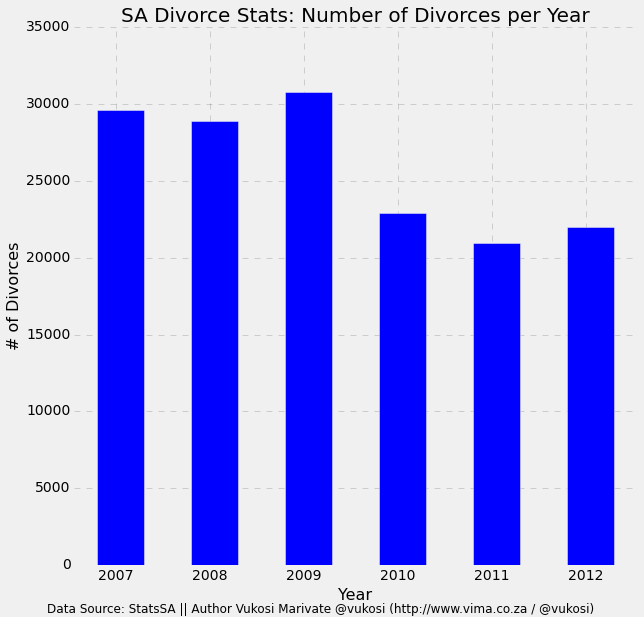
As opposed to this earlier research in the 90s, the current trend for the total number of divorces is down. In 1999 the number of divorces in South Africa was 37098. While the divorces for 2009-2012 were actually lower. With 2010-2012 being in the low 20000s.
If we look at the trends in the raw number, extending it back to 2007, we see that the number of divorces have been decreasing. The raw number might not tell the whole story, there might be something else lurking out there to explain the drop from 2010 onwards.
So is there such a thing as a divorce rate?
That is, the number of divorces per married people in South Africa. The simple answer is no, the complicated answer is, well it’s complicated. Given that people who do get divorced have different durations of their marriage, trying to keep track of all of them is hard. We can look at the ratio between marriages per year and divorces. The big caveat being that the divorces during any year are from different couples who started their marriages at different times.
I would like to acknowledge the assistance of my wife in putting this post together. A lot of nights well spent debating the merits of one argument to another in this data.
— By Vukosi Marivate